
Why Therapists Lose Thousands to Denied Insurance Claims (And the 3 Deadlines That Decide It)
A denied claim is not a lost claim. It is a claim with a clock attached to it.
That distinction is where the money is, and it is also why the money disappears. The denial does not arrive as a crisis. It arrives as a line item in a portal, on a Wednesday, between a 2pm and a 3pm. You register it, you think I need to deal with that, and then twelve more sessions happen. When you look again, the number that mattered was never the dollar amount. It was the date.
Industry research on behavioral health billing puts the first-pass denial rate somewhere around 15–25% (Elite Med Financials), and finds that up to 60% of denied claims are never resubmitted at all (MD Revenue Group). Those are published benchmarks describing the field, not a prediction about your practice — but sit with the second one for a second. The majority of denied claims are not lost to a fight with the payer. They are lost to nobody going back.
Here is the arithmetic that follows from those two benchmarks. This next calculation is ours, and it is an illustration, not a reported statistic: a solo therapist billing $100,000 a year, at a 20% denial rate, who never resubmits 60% of what gets denied, is walking away from roughly $12,000 a year. Not to an insurer's refusal. To a calendar.
Three deadlines decide whether that money comes back. Most practices only know about one of them.
Deadline 1: The appeal window — and it is not 90 days
This is the deadline therapists have heard of, and the one they get wrong most often, because there is no such thing as the appeal window. There is only this payer's appeal window, on this plan, in this state.
The window runs from the denial date, not the date of service and not the date you noticed. Common published figures cluster at 90 or 180 days, but the spread is real and the consequences are absolute: file at day 91 against a 90-day window and the claim is not late, it is closed.
Here is a starting-point reference of commonly published windows. Verify every single one against your own payer contract and provider manual before you rely on it — these differ by plan and by state, and they change:
| Payer | Appeal window (from denial) | Timely filing (from date of service) |
|---|---|---|
| Aetna | 180 days | 120 days |
| Blue Cross Blue Shield | 180 days | 365 days |
| Anthem BCBS | 180 days | 365 days |
| Cigna / Evernorth | 180 days | 90 days |
| UnitedHealthcare | 180 days | 90 days |
| Optum Behavioral Health | 180 days | 90 days |
| Humana | 180 days | 90 days |
| Oscar Health | 180 days | 90 days |
| Medicare Part B | 120 days | 365 days |
| Medicaid (state plan) | 90 days | 95 days |
| Magellan Health | 90 days | 90 days |
| Carelon Behavioral Health | 90 days | 90 days |
| Tricare East | 90 days | 365 days |
Common published defaults, supplied as an editable starting point only.
Look at what that table does to a mental default of "I have about three months." A Medicaid denial and an Aetna denial that land in the same week have deadlines 90 days apart. If you work your denials in the order they arrived, you are working them in the wrong order roughly half the time.
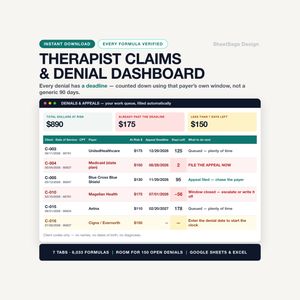
The fix is not discipline. It is a countdown that knows which payer it belongs to. In the worked example inside our claims dashboard, the queue does not sort by date received — it sorts by what is about to expire:
| Claim | Payer | At risk | Days left | What to do |
|---|---|---|---|---|
| C-004 | Medicaid (state plan) | $150 | 2 | FILE THE APPEAL NOW |
| C-005 | Blue Cross Blue Shield | $130 | 95 | Appeal filed — chase for a decision |
| C-003 | UnitedHealthcare | $175 | 125 | Queued — plenty of time |
| C-015 | Aetna | $110 | 178 | Queued — plenty of time |
| C-010 | Magellan Health | $175 | −56 | Window closed — escalate or write off |
C-004 and C-010 are the whole argument. One is worth $150 and needs a phone call today. The other was worth $175 and is now worth an unpleasant conversation. They are separated by nothing except when someone looked.
Deadline 2: Timely filing — the one that kills claims that were never denied
The appeal window at least announces itself; a denial shows up. Timely filing kills quietly, because the claim never generated a piece of paper in the first place.
Timely filing is the payer's limit on how long after the date of service you may submit a claim at all. As the table above shows, it runs anywhere from 90 days to a full year. Miss it and you do not get a denial you can argue with. You get CO-29 — timely filing limit expired, which is the billing equivalent of a locked door. Most payers will not accept an appeal on a timely-filing denial without documented proof of original timely submission, which is exactly the documentation a practice that missed the window tends not to have.
Three ordinary situations produce it:
- A session gets logged, the claim never gets submitted, and nothing on any screen anywhere flags the omission. Nothing is late until suddenly everything is.
- A claim is rejected at the clearinghouse — not denied, rejected, which often means it never counted as filed. The clock kept running the whole time.
- Coordination of benefits: the secondary payer's clock runs from the date of service too, not from the date the primary finally paid.
The countermeasure is unglamorous. Every date of service needs a submission status attached to it, and every unsubmitted date of service needs to know how many days it has left. A therapist who checks that list once a week never meets CO-29.
Look at C-010 in the table above one more time. Its denial reason was CO-29 — it was denied for timely filing, and then the 90-day Magellan appeal window on that denial also closed. That is one claim killed by both deadlines in sequence. It is the most expensive kind of row on a claims log, and the most preventable.
Deadline 3: The A/R clock — the soft deadline that decides the other two
The third deadline has no fixed date, which is exactly why it is the one that gets ignored. It is the age of your unpaid claims.
Accounts receivable aging splits everything owed to you into buckets by how long it has been sitting. Here is the worked example from our dashboard:
| Bucket | Open claims | Outstanding | Share of A/R |
|---|---|---|---|
| 0–30 days | 4 | $560 | 40.4% |
| 31–60 days | 2 | $195 | 14.1% |
| 61–90 days | 1 | $175 | 12.6% |
| 90+ days | 3 | $455 | 32.9% |
| Total | 10 | $1,385 | 100% |
A third of that practice's outstanding money is in the 90+ bucket. That is the bucket where claims are old enough that appeal windows have started closing behind them — and every dollar in it against a single payer is a phone call that is worth making today.
The headline metric is Days in A/R: everything still owed to you, divided by your average daily charges. The commonly cited behavioral-health benchmark is under 35 to 40 days (Medheave). The example practice above is sitting at 74.6 days against a target of 35 — not because any single claim went catastrophically wrong, but because nothing was being worked in age order.
Why this is a deadline and not a metric: A/R age is the leading indicator for the other two. A claim that quietly ages past 60 days is a claim whose denial, when it eventually surfaces, arrives with much less of its appeal window left. Practices that keep Days in A/R low almost never lose money to expired appeal windows, because nothing sits around long enough to be forgotten. The aging report is where you catch a deadline before it becomes one.
A working rule: any submitted claim with no payment after 30 days gets chased. Not investigated, not agonized over — chased.
What a weekly denial routine actually looks like
Fifteen minutes on a Friday, in this order:
- Anything with fewer than 7 days on its appeal clock. Sorted by days remaining, not by dollar value. A $110 claim expiring Tuesday outranks a $400 claim expiring in November.
- Anything unsubmitted approaching its timely-filing limit. These are invisible unless you deliberately look.
- The 90+ A/R bucket, by payer. One payer's name will keep appearing. That is the phone call.
- Payments that came in short. A payer sending $88 against a $110 contracted rate is not a paid claim, it is an underpayment that got filed as a win.
- No-show and late-cancel fees you charged and never collected. In the worked example, $400 in fees charged, $150 collected — $250 still owed, at a 37.5% collection rate. It is money you already decided you were entitled to.
Track denial rate by payer and reason code by frequency while you are there. Denials cluster. When one payer accounts for a disproportionate share of your denials, that is not bad luck — it is either a fixable habit on your end (authorization lapses, a modifier you keep omitting) or a genuine argument to bring to your next contract negotiation. Walking into a renegotiation holding that payer's denial rate and aging profile is a materially different conversation than walking in with an impression.
Put the clock where you cannot miss it
None of the above requires billing software, a service taking a percentage, or a subscription. It requires that every claim carries its own deadline on its own row, calculated from that specific payer's window.
Our Therapist Insurance Claim & Denial Recovery Dashboard does exactly that, and it does it PHI-free by design — no client name field, no date of birth field, no diagnosis field anywhere in the workbook. You identify clients with your own code (C-001, C-002) and keep the code-to-name key wherever you already keep your protected records. It tracks money and dates, not people.
- CLAIMS LOG — 300 rows. Enter the date of service, CPT, payer and amount; filing deadline, appeal deadline, days left, days in A/R, aging bucket, underpayment and a plain-English alert calculate themselves.
- DENIALS & APPEALS — the work queue above, filled automatically, ranked by what expires first, with dollars at risk, dollars already past deadline, and your appeal recovery rate.
- A/R AGING — the four buckets, in dollars and as a share, broken out by payer, with Days in A/R against your target.
- NO-SHOW TRACKER — the second leak, valued at your own rates, with your actual fee collection rate.
- DASHBOARD — month by month, denial rate by payer, denial reasons ranked, and one figure at the top: recoverable money identified.
- SETTINGS — 14 payers pre-filled with common published windows and filing limits, every one editable, plus your CPT codes and contracted rates.
Google Sheets and Microsoft Excel, one file, instant download, no subscription.
A denied claim is not a verdict. It is a countdown that started without telling you.
This is a tracking and organization tool and an informational article — not legal, tax, billing or compliance advice, and not a substitute for your payer contracts. Appeal windows and timely-filing limits vary by payer, plan and state and change over time; verify every figure against your own provider manual. The denial-rate and resubmission figures cited are published industry benchmarks describing the field, not a prediction about any individual practice. The $12,000 figure is our own arithmetic illustration built on those benchmarks, not a reported statistic. No reimbursement rate, recovery percentage or financial outcome is promised. Worked-example figures come from the sample data shipped inside the workbook.
 Every denied claim has a clock on it. When the clock runs out, that money is gone for good.…
See the Therapist Claims & Denial Recovery Dashboard →